The test
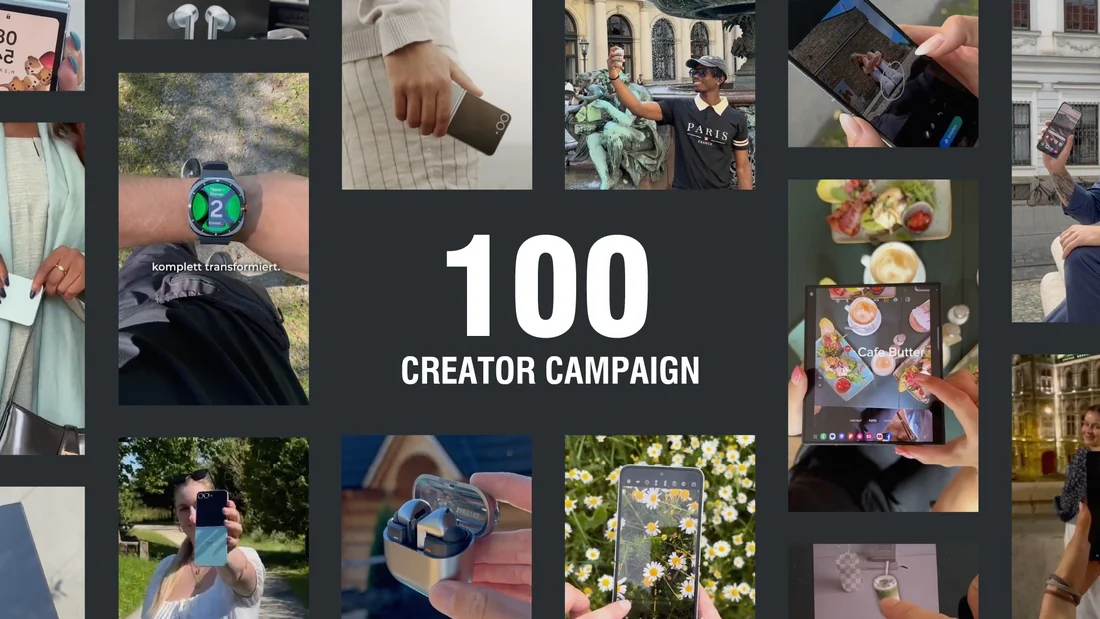
TikTok's own case study on a Samsung Germany campaign describes a third-quarter-2024 push to build awareness for a slate of new devices — the Galaxy Z Fold6, Z Flip6, Watch Ultra, Buds3 Pro and Galaxy Ring — with a particular focus on the phones' AI features. The case study says Samsung worked with 100 creators spanning follower counts from roughly 1,000 to 1.5 million, producing 106 pieces of creator content across formats including product critiques, ASMR-style demonstrations, vlogs and quick assessments. TikTok's account splits the plan into two tracks: broad-awareness content for a general audience, and a segmented track for viewers already considering the AI features, with three paid ads rotated every three to four days across a four-week run.
What the evidence says
The paid-media results in the case study — a 125% increase in average watch time, a 141% increase in click-through rate and a 53% reduction in cost per click — are TikTok's own comparison, and the case study does not name the baseline campaign those percentages are measured against. The organic side is reported in absolute engagement-rate bands by creator tier: TikTok describes micro-creators reaching engagement rates up to 26%, mid-tier creators averaging 6.2% with a single top performer at 15.8%, macro-tier creators averaging 8.1%, and a top tier averaging 15% with what the case study calls only 7% variance between performers. A separate figure attributes 10.8% combined engagement to the top tier overall, 9.4% to music creators and 11.0% completion to tech-focused creators. These are TikTok's own tallies of a client campaign, not figures Samsung itself has disclosed in this record.
The sample and the variance
The sample is 100 creators and 106 assets, in one country, over one quarter, for one advertiser — a portfolio-testing approach, not a controlled experiment with a held-out comparison group. TikTok's own case-study hub presents this among a curated set of client stories, so the Samsung result is a selected example, not a representative sample of what a hundred-creator campaign typically returns. The tier bands describe a spread, including a claimed 7% variance among top-tier performers, but the case study gives no absolute view counts or spend alongside those percentages, so a reader cannot judge how much reach underlies each rate.
What to try next
This is an editorial reading of a vendor's account, not marketing advice. A marketer weighing a similar campaign can reasonably ask for the absolute reach and spend behind any percentage lift, request the same tier breakdown for campaigns not selected for publication, and treat AI-feature and broad-awareness messaging as two separate tests, not one blended result.
- What baseline campaign are the paid-media percentage changes measured against?
- Do the organic engagement bands reflect views, likes, comments, shares, or some combination TikTok has not defined here?
- How does this selected case study compare with unpublished multi-tier campaigns from the same advertiser or category?
A hundred-creator, multi-tier structure is a documented approach, not a formula; TikTok's own case study shows what it measured for one advertiser in one quarter, and it stops short of showing whether the same tier mix would repeat those bands for a different brand or category.
Sources & limits
- Samsung 100-creator campaign case study (TikTok for Business) ↗
TikTok's own reported creator counts, content mix, paid-media lift and tiered organic engagement bands.
Source · Source publication date not stated · Archive retrieval: 2026-09-16 - TikTok for Business Inspiration hub ↗
Confirms the case study is one selected example within a curated gallery TikTok maintains.
Source · Source publication date not stated · Archive retrieval: 2026-09-16