Write down what each count means
Since 31 March 2025, YouTube counts a Shorts view when the Short starts to play or replay, with no minimum watch time; the earlier measure remains in Analytics as “engaged views” for viewers who chose to continue watching (YouTube Help). That makes raw views a start/replay count, not a count of people, qualified watches, or completions. Do not divide another metric by views unless its definition uses that denominator.
Keep the attention measures separate
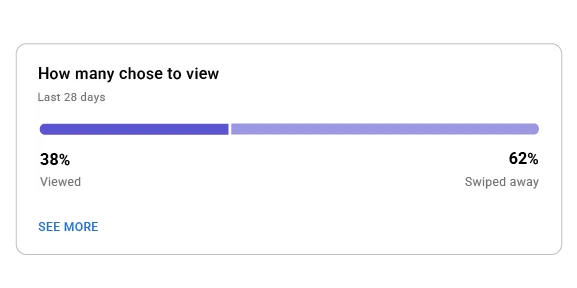
“How many chose to view” is the percentage that viewed rather than swiped away in the Shorts feed. Average view duration is calculated from engaged views and their watch time; YouTube defines it as average minutes watched among those who stayed to watch (YouTube Help). Average percentage viewed relates watched duration to video length. Each answers a different question: initial choice, time retained, and proportion consumed.
Account for replay behavior
A replay can raise starts and watch time. A loop that produces average percentage viewed above 100% may indicate useful replay, an intentionally seamless loop, accidental restart, or confusion. It does not by itself mean satisfaction. Check likes, comments, subscriber change, destination action, and the retention curve’s shape. If viewers repeatedly revisit one instruction, improve the explanation before celebrating the replay.
Diagnose in an order
First check delivery: was the Short shown in feed? Second inspect choice: did viewers watch or swipe? Third inspect the curve: where did engaged viewers leave or repeat? Fourth check outcome: did the right action occur? YouTube says choice to view, average view duration, and average percentage viewed inform recommendation, alongside satisfaction signals and external factors (YouTube Help). That description is directional, not the complete ranking system.
Use a denominator card
For every review, record Short length, date window, traffic source, views, engaged views, chose-to-view rate, average view duration, average percentage viewed, and desired action. Add a plain-language denominator beside each rate. Compare only Shorts of similar purpose and length over the same maturity window. A 12-second visual loop and a 90-second explanation should not share a target.
Annotate the retention curve before editing. Mark the moment the promise appears, every context switch, the first proof beat, the payoff, and the CTA. Then connect a drop or replay region to the nearest content event and write two competing explanations. Testing one revision against another comparable set is more useful than declaring that every dip means boredom.
Worked hypothetical: a 30-second Short has 10,000 starts, 6,000 engaged views, and 21,000 seconds watched by engaged viewers. Its average view duration is 3.5 seconds using those illustrative inputs. That example teaches arithmetic only; it is not a benchmark, expected outcome, or claim about YouTube’s private calculations.
Put it into practice
Sources & limits
YouTube's public definitions do not disclose the full recommendation system. Analytics may be revised, delayed, limited, or rounded, and replay effects cannot be interpreted from one aggregate rate alone.
- Get started creating YouTube Shorts ↗
Current Shorts view counting and the retained engaged-views metric.
YouTube Help · Source publication date not stated · Reviewed: 2026-09-19 - Understand your YouTube engagement ↗
Definition and denominator basis for average view duration and watch time.
YouTube Help · Source publication date not stated · Reviewed: 2026-09-19 - Search & discovery tips — Shorts ↗
YouTube's public account of choice, duration, percentage viewed, satisfaction, and external recommendation factors.
YouTube Help · Source publication date not stated · Reviewed: 2026-09-19